POLLER
SNMP was supposed to be replaced "soon" after 1988. That was 37 years ago. USP started there, then kept going. Five agentless protocols, six output backends, one platform. Monitor everything from network switches to Windows servers to bare-metal BMCs, delivered to the observability stack of your choice.

You Know This Pain
Your infrastructure speaks five protocols. Your monitoring tools each handle one. Modern observability platforms? They want agents on everything or they don't care.
Proprietary Formats Everywhere
Your SNMP vendor uses YAML MIBs. Your WMI tool needs agents. Your BMC monitoring requires a separate platform. Three tools, three formats, none of them talk to each other.
Agent Sprawl
Every Windows server needs an agent. Every agent needs a change request, a security review, an AV exclusion, and a patching schedule. Multiply by hundreds of servers.
Collector Islands
Each poller is configured independently via config files. No central management. No visibility. Pure chaos at scale.
Single Backend Lock-in
Your collector only speaks to one platform. Want to send data to both Elastic and Datadog? Run two collectors.
Actually Works™
Not "works most of the time" or "works if you configure seventeen things correctly." It genuinely, improbably, works.
Native SNMP with Real MIBs
Upload any ASN.1 MIB file. It compiles. It works. No YAML translations, no vendor profiles, no 31,000 field templates bloating your cluster state. The standard exists. USP reads it.
- SNMPv1/v2c/v3
- One-click MIB import
- Automatic dependency resolution
- O(1) OID lookups
Agentless Windows Monitoring
WMI over native WS-Management. No agents, no PowerShell remoting, no shell execution. USP sends WQL queries directly to the Windows host using a read-only monitoring account.
- Native WS-Man Enumerate/Pull
- NTLM auth with connection reuse
- Stock templates: CPU, Memory, Disk, Network, Services
- Least-privilege: read-only WMI account
Hardware Health via IPMI & Redfish
Out-of-band monitoring through the server's BMC. Temperature, fan speed, power consumption, drive health. The server doesn't even need to be booted.
- IPMI v2.0 over RMCP+ and Redfish REST/JSON
- Sensor collection: temperature, fan, voltage, power
- System Event Log retrieval
- Works with Dell iDRAC, HPE iLO, Supermicro BMC
Adaptive Intelligence
Legacy pollers hammer devices until they break. USP listens. The agent calculates EWMA of response times, dynamically adjusting polling frequency.
- Auto-tuning intervals per device
- Fast lanes and slow lanes for traffic
- Host health tracking isolates problems
Unbreakable Resilience
Network partitions happen. Backends fail. Your monitoring shouldn't stop.
- Circuit breakers detect backend failures
- Durable disk-backed buffering
- Rendezvous hashing for automatic failover
- No single point of failure
Multi-Backend Output
Send data to one platform or all of them simultaneously. Your observability stack, your choice.
- Elasticsearch & OpenSearch
- Datadog, New Relic, Splunk
- Prometheus & OpenTelemetry
- Simultaneous multi-destination
How It Works
Simple data flow. Powerful results. No PhD in YAML required.
How USP Stacks Up
Side-by-side with the tools you're probably already frustrated with.
| Capability | USP | DataDog | Splunk | ElastiFlow |
|---|---|---|---|---|
| Standard ASN.1 MIBs | Profiles | YAML | ||
| Per-MIB Polling Intervals | ||||
| Central Controller | ||||
| Multi-Backend Output | Simultaneous | Native only | Native only | ES only |
| Adaptive Polling | EWMA-based | Partial | ||
| Agentless Windows (WMI) | Native WS-Man | Agent required | Agent required | N/A |
| Hardware Health (IPMI/Redfish) | Native | Agent-based | N/A | |
| Agent HA / Failover | HRW Hashing | |||
| WebUI Management | Full GUI | YAML files | ||
| External Dependencies | None | Agent required | Heavy Forwarder | Multiple |
See It In Action
A real interface for real network engineers. Not a config file with aspirations.
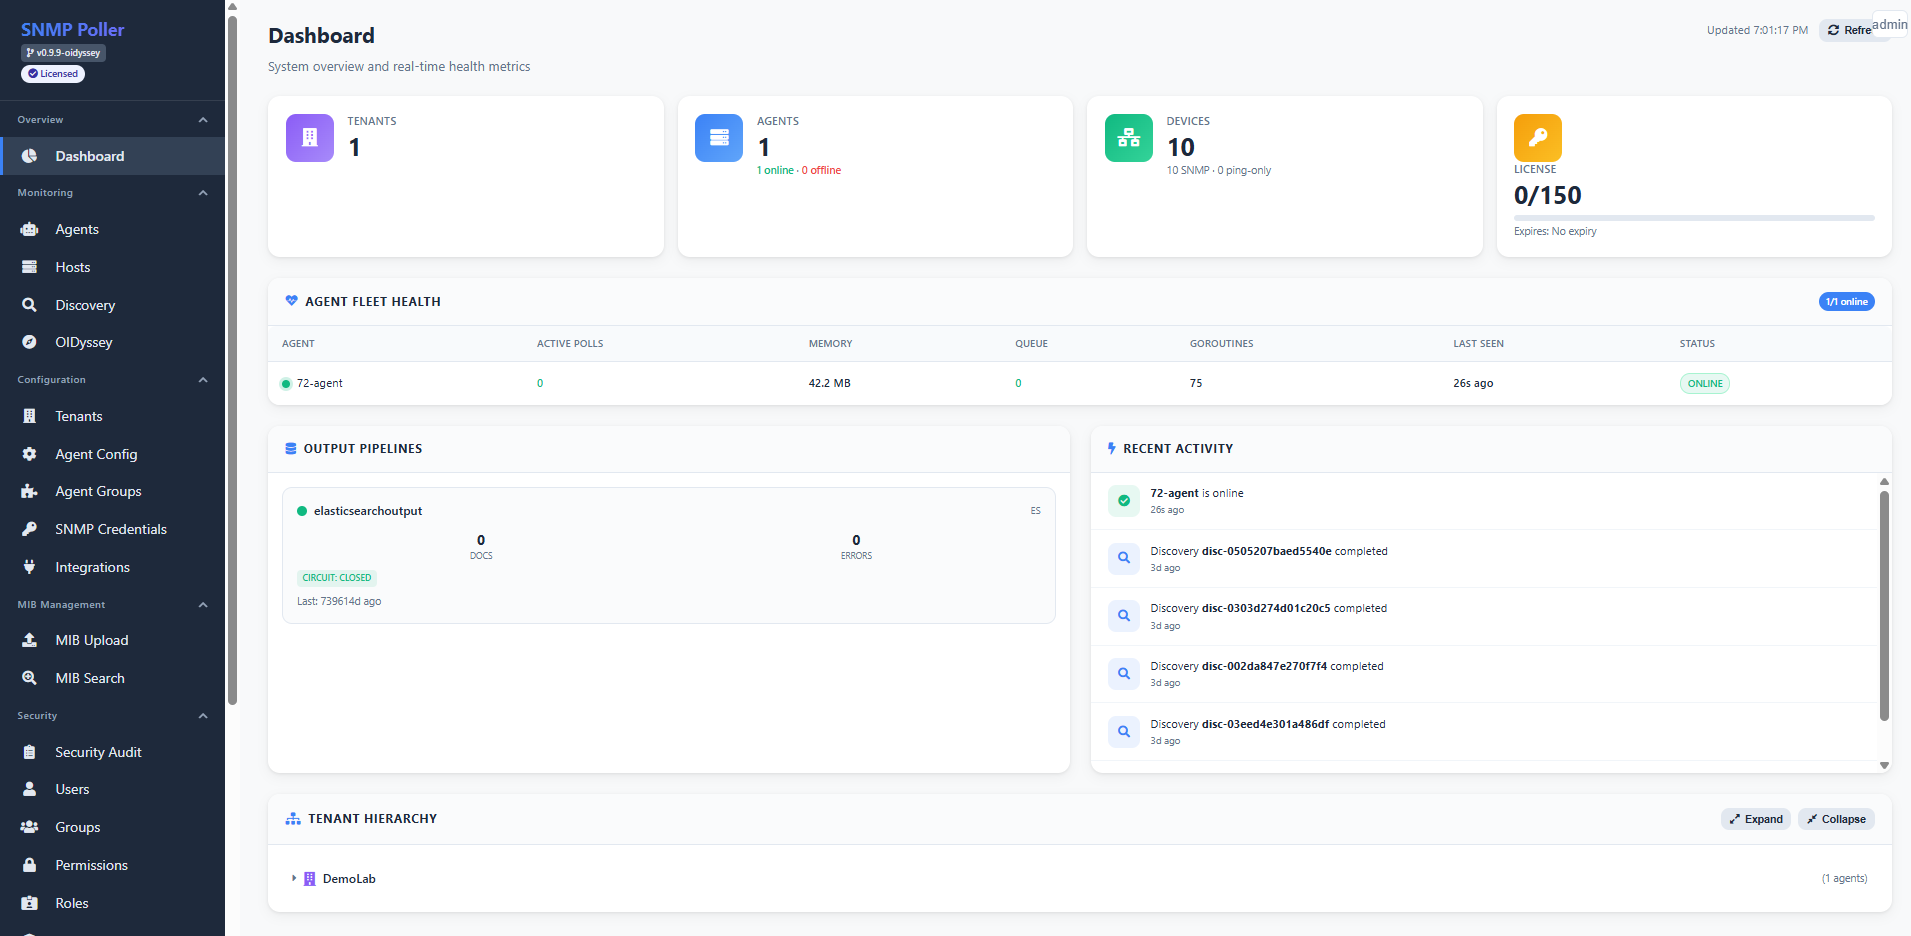
Dashboard
Fleet health, output pipelines, agent status at a glance
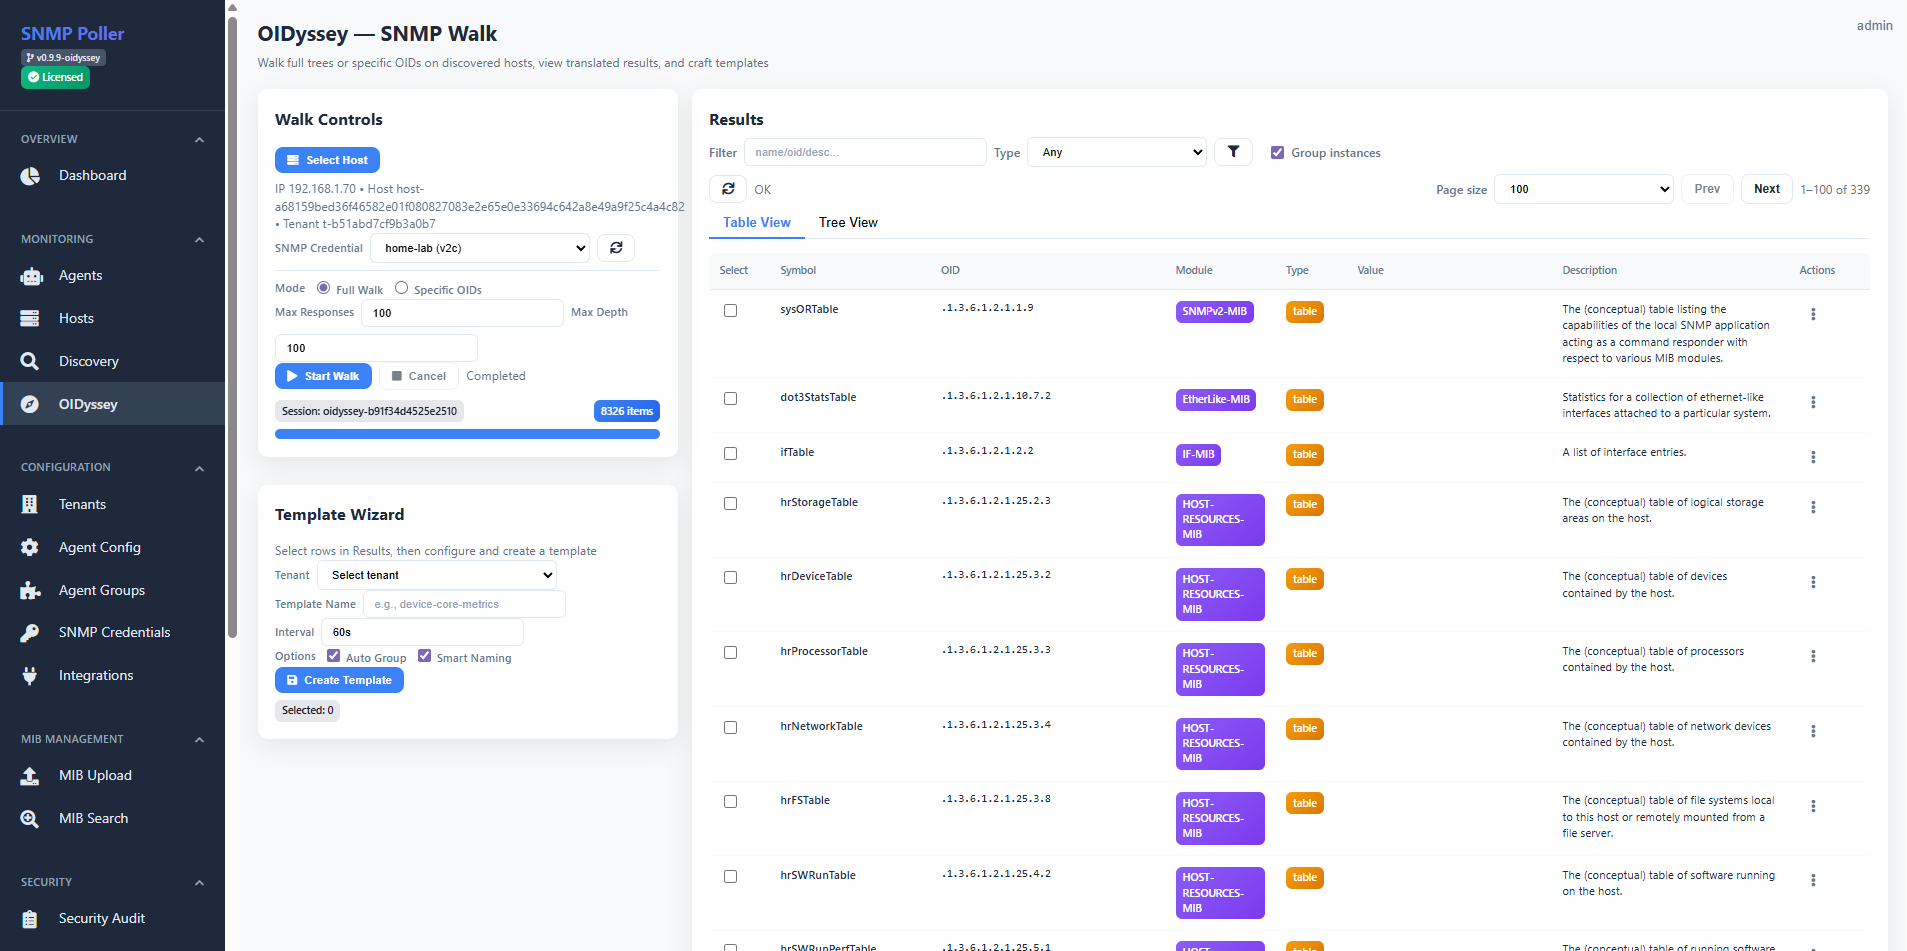
OIDyssey Walker
Live SNMP walks with automatic MIB translation
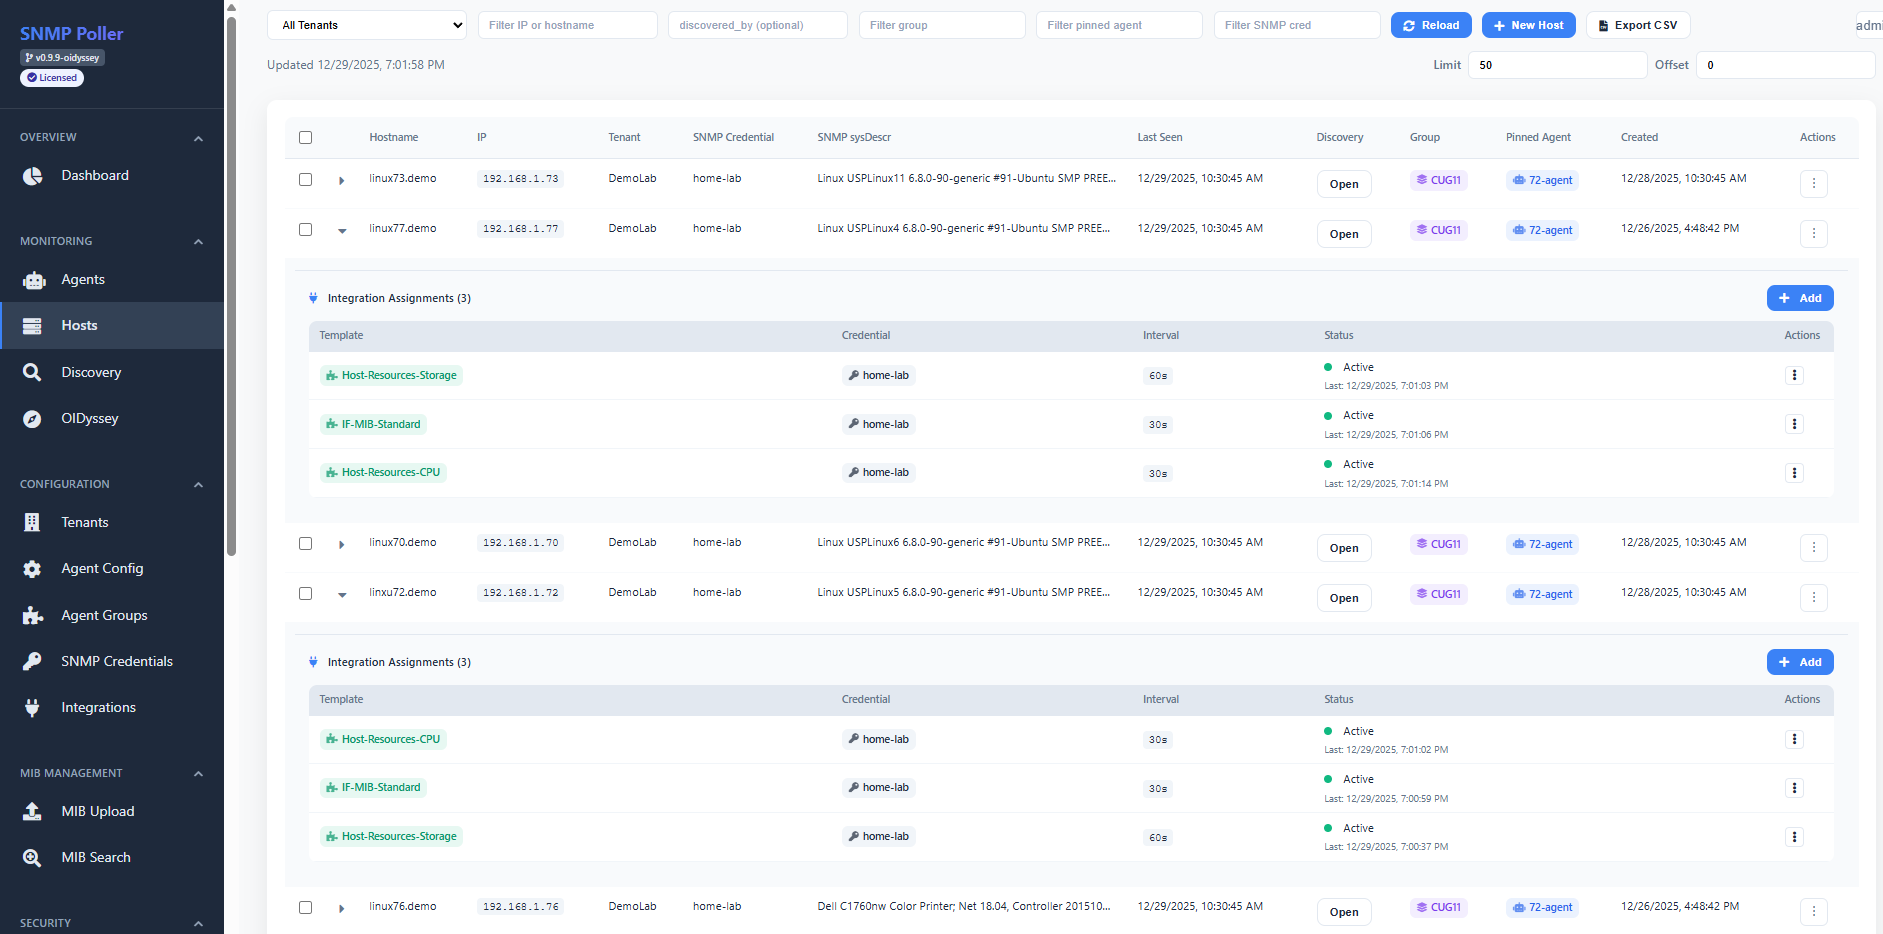
Host Management
Per-host integration assignments with independent intervals
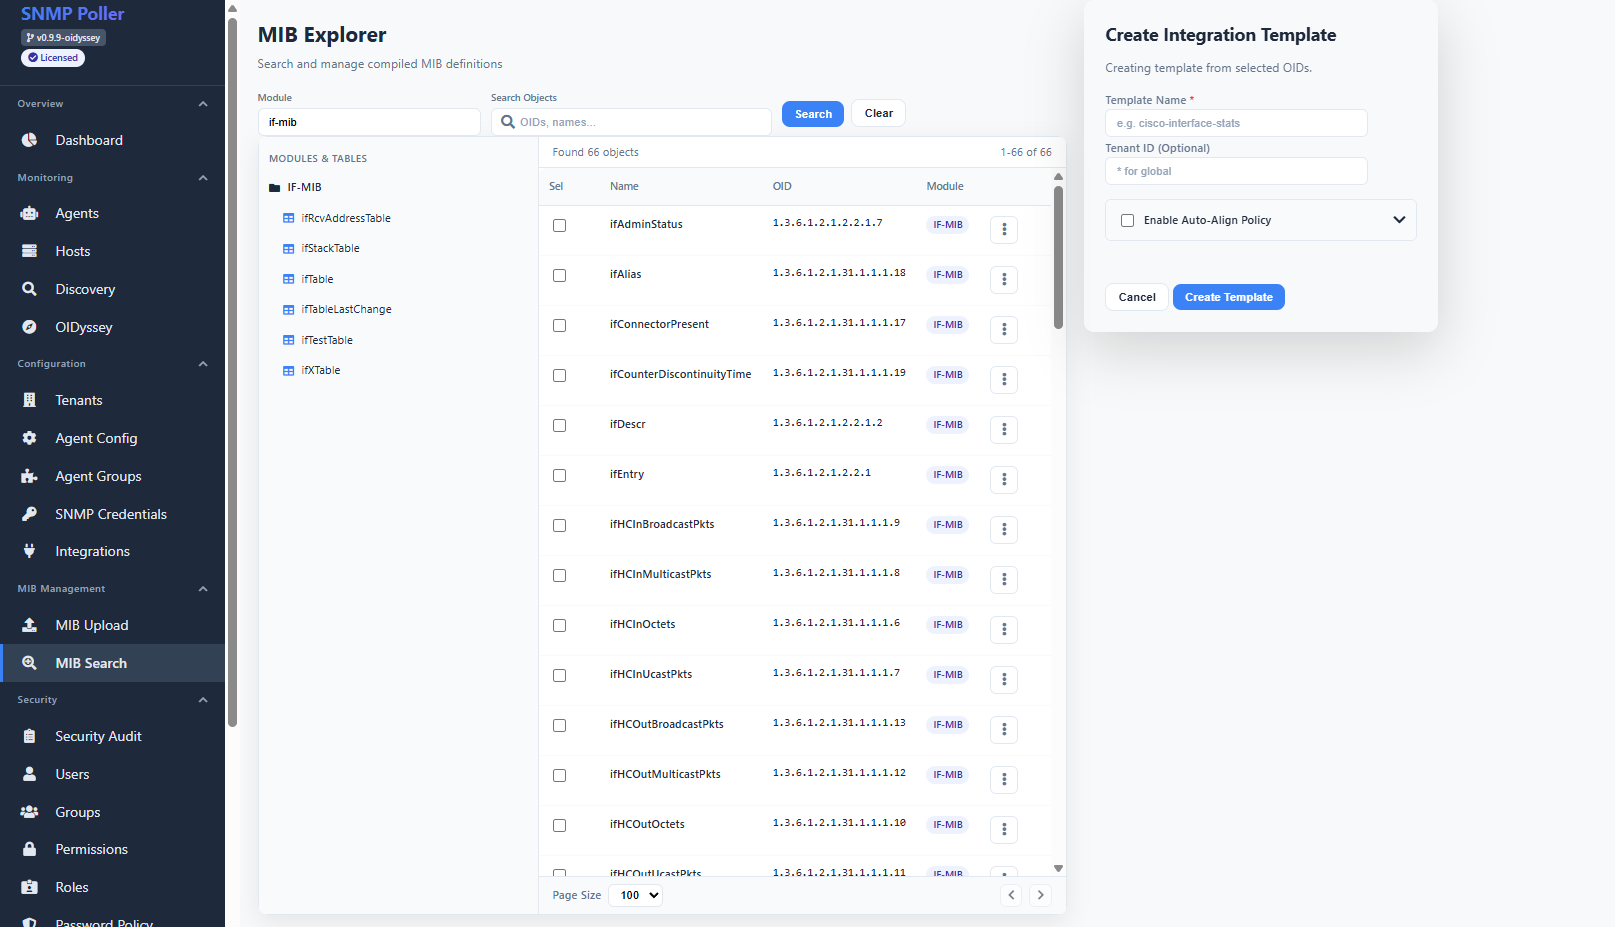
MIB Explorer
Browse compiled MIBs, search OIDs, create templates
Works With Your Stack
Native connectors. No middleware. No custom scripting.
Configure multiple backends per agent. Send interface metrics to Datadog for real-time alerting and to Elasticsearch for long-term analysis. Simultaneously. Because that's how real infrastructure works.
All product names, logos, and trademarks are property of their respective owners. Use of these names does not imply endorsement.
In Which Someone Finally Gets Annoyed Enough
It started with frustration.
We needed SNMP data in Elasticsearch. The tool we had used proprietary YAML definitions instead of standard MIBs. New device? Hope the vendor had written a profile for it, or maintain your own fork forever. One polling interval per device. Single collector, no failover. And the YAML definitions generated so many Elasticsearch field templates that our cluster state eventually became the problem. We were spending more time managing the monitoring tool than managing the network.
So we built USP to do SNMP the way it should have been done from the start. Parse the actual MIBs. Poll the devices. Deliver the data. Stop inventing problems that don't need to exist.
Then someone asked about Windows servers. Every vendor's answer was the same: install our agent. On every server. Through change control. We figured if we could poll a switch over the network, we could poll Windows over the network too. No agents. Same pipeline.
Then the AI cluster boom happened, and suddenly everyone cared about hardware health. Temperatures, fan speeds, power draw, drive life. Same architectural pattern. Agentless, network-based, data into the same outputs.
We didn't set out to build a multi-protocol monitoring platform. We set out to fix one broken tool. Each next step was just obvious.
"There is a theory which states that if anyone ever discovers the perfect SNMP integration, it will instantly disappear and be replaced by something even more inconceivable. Another theory states this has already happened several times."— Perpetual Obsolescence Technologies
Simple, Honest Pricing
No surprise invoices. No per-metric billing that requires a finance degree to predict.
- 100 hosts
- 5 custom collections
- 1 tenant
- Community support
- All 7 output backends
- 500 hosts
- Unlimited collections
- 5 tenants
- Email support
- All 7 output backends
- Unlimited hosts
- Unlimited collections
- Unlimited tenants
- Dedicated support
- Custom integrations
Up and Running in 5 Minutes
No installer wizards. No configuration marathons. Just download, unzip, run.
Ready to Monitor Everything?
Free version includes 100 hosts, 5 custom collections, and 1 tenant. No time limit. No credit card. One zip file. Five minutes to your first metrics.
Questions? Concerns? Existential dread about SNMP? → support@perpetual-obsolescence.tech